Excel has made me a million bucks
Actually a truckload more than a million. Just two clients have paid me more than half a million each for Excel spread sheets.
Once I built a single $30,000 spread sheet. The client needed a decision making tool to help them scrap a $100 million contract while losing the least amount possible. I got them down to losing only $45 million. $30K isn’t much in the grand scheme of things!
Safe to say I understand Excel. I have been working with Excel as a management reporting tool since 1989. My Excel blog started with my first Excel Tip in Feb 2004. I have written hundreds of “how to” articles about Excel since then with millions of views.
Improve Productivity
Monthly workbooks can be consolidated with total reports allowing drill down to individual components and numbers. Any excel file which is used over and over should be recreated as a template. Your time is valuable, don’t waste it with repetitive tasks; let Excel help you!
Reduce Waste
Why pay your staff to do the same thing over and over? Repetitive actions and tasks can be automated easily saving seconds, minutes or even hours. A quoting template is a perfect example. You want your sales staff telling you how many quotes they have written, not how long it took to write them!
Highlights
Business Intel
Excel is the worlds most used Business Intelligence (BI) tool for data analysis. Any set of raw data can be analysed for trends, comparisons, outliers or inliers, and of course extrapolating for the future. Whether it is staff performance, machine productivity, breakdown analysis, revenue or expenses analysis, an excel spread sheet is the ideal tool.
Highlights
Management Reporting
Many times we have written management reporting tools as (comparatively) inexpensive prototypes for custom software installations. Data analysis can be used to provide valuable business information for making decisions that can improve your business. Often the information you need is there but you are just unaware of it.
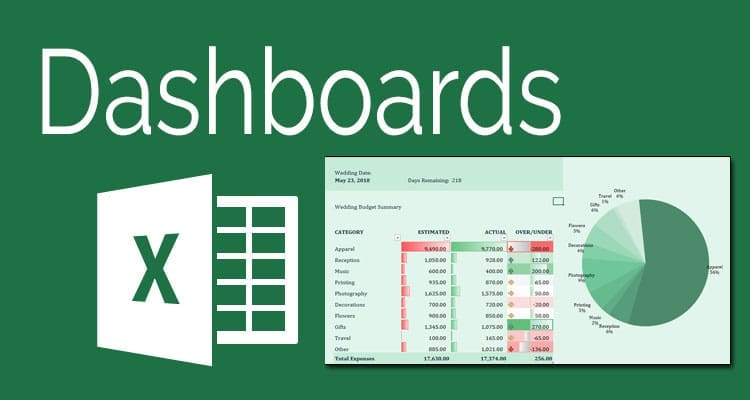
A dashboard sometimes is a complete waste of time, and I will tell you that. Other times it can be the quick visual indicator to an underlying problem that an executive can spot and jump in and solve. A sexy interactive report can be published online (privately of course to those who are authorised) that allows users to drill into the underlying data using the not so sexy backend server tools provided by PowerBi and SharePoint.
Sexy Reports
Who doesn’t love a shiny report full of pie charts and dotted line charts. Even better when that can be visually represented on a screen with traffic lights for good average and bad results. Executives love these things and they do have their uses in certain scenarios.
Highlights
Training
Our approach to Excel Training has long been to personalise it to the users specific existing skills and work loads. We look at the daily use of excel to perform tasks and then find ways to improve a users productivity.
Highlights

Productivity Focused
This may include better spread sheet design, understanding and using formulas and functions that can improve their use of the tool, or even just keyboard shortcuts to speed them up. Our training results in happier, more productive staff who get things done faster and better.
“Trusted Tech Advisors (Jethro Management) were able to create a management reporting tool that met the Transport and Main Roads executive reporting requirements while radically reducing staff workload in creating it.
The built in validations made the process of checking the results for accuracy a breeze. It is simple to maintain but able to handle the many complexities of reporting for different areas and combining data from systems with different structures.”SUSAN - DIVISIONAL FINANCE MANAGER (QLD TRANSPORT AND MAIN ROADS)